The leasehold and ground rents scandal of Hillingdon

Freehold or Leasehold .. which is best? Well, when buying a property in the UK there are two main types of ownership – freehold and leasehold and, when boiled down, they mean the following…

Freehold: The person who owns the freehold of a property owns the property and the land it stands on.

Leasehold: As a leaseholder you do not own the land the property is built on. A leaseholder essentially rents the property from the freeholder for a number of years, decades or in some Victorian terraced houses, for centuries. 

All apartments have to be sold as leasehold properties because of the very nature that you have a neighbour above or below you (so both of you can’t own the land) with the length of the lease being over 100 years (even more sometimes).

However, with some apartments – particularly Victorian and Edwardian houses converted into numerous apartments – which are sold on the basis that the leasehold apartment owner also owns part of the freehold (with other leaseholders in the same building), having what is known as ‘share of freehold’.  Similarly, the Government also brought in legislation a number of years ago for more modern apartment blocks built in the 20th century where it allowed leaseholders to club together and have the right to purchase the freehold together.

Now we must stress, there is nothing wrong with leasehold – it’s been a useful type of homeownership since Norman times, it’s just that with a leasehold comes a potential extra responsibility. If there are four apartments in a block, who pays for the leaking roof when all benefit from a watertight roof? Who pays for the bad foundations, when all benefit from good foundations? Who pays for building insurances? .. the list goes on – so clauses are added to the leasehold agreement to ensure everyone is protected and pays their fair share of the joint costs of the building with service charges and a nominal ground rent (ground rent is a nominal rent, commonly quite low, often in the region of £50 per year to the freeholder of the property).

Whilst houses tend to be sold as freehold as it’s a more unambiguous set-up, given there is only one property on the land. Contentiously however, in the last 20 to 25 years this has not always been the case with new-builds as some new homes’ builders have sold the leasehold to the buyer and retained the freehold. There is nothing wrong with that, it’s just in some cases (not all) they also added some oppressive clauses to the lease of the property they were selling, which could be the next PPI scandal – albeit for property.

Government reports have emerged recently that suggest 12,000 leaseholders in the UK are facing ground rents – which they pay to the freeholder – that double in cost, usually every 10 years, but occasionally more frequently.

Builders started to add clauses into leasehold property sales with ground rent being set at £300 and £400 a year, yet it doubled every ten years. Though unwary first-time buyers were habitually told that their 500 and 999-year leases were practically freehold, the clauses inescapably meant that the ground rent would spiral to ridiculous levels meaning the average ground rent would be £23,750 a year by 2070 and £379,900 a year by 2130, making the properties practically unsellable today, with owners often left unable to re-mortgage too.

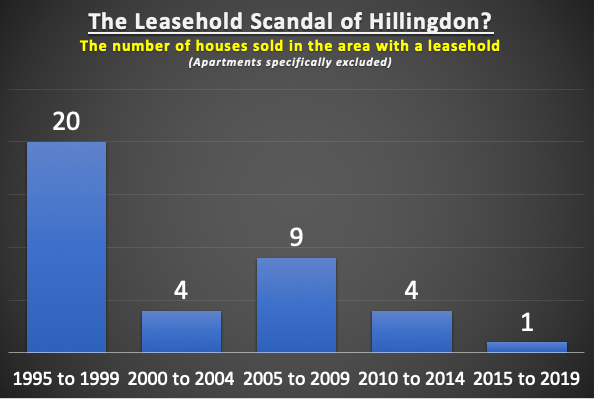
So, how many people are affected by this in our local area?

Well, using Government data, our research suggests that in Hillingdon 38 householders have bought a detached house, semi-detached house or town house (which would normally be freehold) as leasehold. Not all these have onerous lease clauses, yet some do. I know it doesn’t sound a lot, yet that is potentially 38 lives ruined with houses they can’t sell – making them prisoners in their own property.

The good news is the Government is on the case and serious about sorting this issue out as they have proposed a ban on the future sale of houses as leasehold, as well as cutting ground rents to zero. Yet stern questions remain about the future of homeowners in existing leaseholds. Westminster wants the builders to set up compensation plans, and we will say many (not all) have stepped up to the mark and started to sort this, although some campaigners have said the schemes are not fit for purpose, let’s hope they are wrong.

Are Hayes Builder’s Constructing the Wrong Type of Property?

The British housing market has never been so newsworthy. Every other day, there is an article in the newspaper or online about impending house price drops, house price rises, building on green belt, mortgage rates up/down, first time buyer affordability and the woes of being a buy to let landlord, to mention but a few. As a nation, we have a strong national desire to be homeowners.

The English Housing Survey stated the proportion of owner occupied households increased steadily from 52% in the early 1980s to 2003 when it reached its peak of 71%. Since then, owner occupation gradually declined to 63% in 2014, yet in fact increased to 64% in 2017 and has stayed there since.

One of the main motives of home ownership is the prospective tax-free capital appreciation that can be obtained. It’s no wonder the phrase ‘as safe as houses’ is popular in the English language, as many homeowners use homeownership as a nest egg or even a pension pot, as savings rates are at extraordinarily low levels.

Yet even with the news that homeownership is on the rise, the biggest seismic shift to the Hayes property market is the growth of the rental market, which has more than doubled in the last 15/20 years. So how can the social housing sector (Council Housing) remain roughly at the same level since the millennium, homeownership slightly grow, yet the private rental sector be so huge? Well it comes down to the fact that many more homes have been built in Hayes in the last 15/20 years, and a lot of them have been bought for buy to let, or Hayes homeowners with second hand starter homes have also sold them to buy to let landlords and they have bought larger brand new homes.

Yet the question we wanted to ask is … are we building the right sort of homes, especially when it comes to the number of bedrooms? Whilst the data doesn’t exist for Hayes, the country’s stats are available and it makes fascinating reading…

Looking at the graph in 2008, 59% of new homes built were one and two beds, yet last year that had dropped to 35%.

The Housing Minster said recently he was concerned that new homebuilders were building the wrong types of homes in the wrong places at the wrong prices. Many (not all) tenants are tenants because they can’t afford the deposit and as there is a direct coloration between the rent’s landlords charge and tenant’s earnings (i.e. as earnings go up, rents go up and vice versa), and earnings for the last seven years have been subdued, the property tenants have been able to afford in Hayes are the smaller one and two bed properties. Yet a lot of these tenants are now having families (with the need for larger property with three, even four bedrooms).

Looking at the stats for Hillingdon, it can be seen the vast majority of homeowners live in the larger properties with more bedrooms, whilst private rental tenants are in the smaller properties (with less bedrooms).

Our concern is – will young families and professionals be able to afford to live and work in Hayes, especially as the local authorities are unable to build council housing (aka Social Housing)?

One symptom of all these issues mentioned above is the massive growth in multi-family households (i.e. households containing two or more families), which have increased by 42% in under a decade. Now of course many will be because of older couples moving in with their adult children yet many are unrelated families sharing a house, something that simply shouldn’t be happening in 2019.

If we don’t increase the supply of the ‘right’ sort of homes, what will their living conditions be like?

Whilst we are still a country of homeowners and even though there has been a slight growth in numbers, the long term trend is downwards if we don’t build enough of the ‘right’ new homes, in the ‘right’ location and the ‘right’ price, Hayes people will continue to increasingly rent … which is only good news for Hayes buy to let landlords.

What’s the biggest street in Hayes (UB3)?

Well my recent articles about Hayes’s most moved street in the last 3 years and the Monopoly board article (the one where I listed the most valuable streets) caused quite a lot of interest locally, so I decided to see what else I could find out about the UB3 postcode area, and I have been able find out the biggest streets in the Hayes (UB3) postcode area.

Don’t worry, I will get back to some hard-hitting articles about the lack of new homes being built in Hayes, the trials and tribulations of being a Hayes buy-to-let landlord and the future of the Hayes property market .. yet in this article because of the previous positive comments, I wanted to give you what you, the Hayes homeowners and Hayes landlords asked about and wanted!

The biggest street in UB3, when it comes to the number of houses on it is Station Approach, with 580 homes. In second place is Station Road with 317 homes and in third is Bourne Avenue with 299 homes.

Not surprisingly, the most valuable street of the top 20 biggest streets is Station Approach at £183m with an average value of £315,000 per property.

The street with the greatest number of movers in the last 3 years is Station Road, with the highest saleability rate of 34.7%.

The full breakdown can be found in this chart below.

Street/Road Number of Properties on the Street(s) Total Value of Properties on the Street(s) Average Value of Properties on the Street(s) Number of Properties Sold on that street(s) in last 36 months Saleability/Turn-over Rate in the last 3 years (# Houses divided by sales)
Station Approach 580 £182,976,000 £315,000 42 7.2%
Station Road 317 £94,058,000 £297,000 110 34.7%
Bourne Avenue 299 £97,691,000 £327,000 13 4.3%
High Street 293 £87,830,000 £300,000 13 4.4%
Coldharbour Lane 284 £98,043,000 £345,000 12 4.2%
Avondale Drive 254 £47,200,000 £186,000 3 1.2%
Botwell Lane 251 £83,179,000 £331,000 8 3.2%
Varcoe Gardens 249 £88,469,000 £355,000 20 8.0%
Grange Road 245 £76,656,000 £313,000 4 1.6%
Clayton Road 233 £67,302,000 £289,000 7 3.0%
Blyth Road 232 £64,975,000 £280,000 13 5.6%
Waltham Avenue 212 £85,675,000 £404,000 5 2.4%
Dawley Road 206 £74,380,000 £361,000 17 8.3%
Central Avenue 188 £76,980,000 £409,000 10 5.3%
Church Road 185 £82,749,000 £447,000 10 5.4%
Cranford Drive 174 £63,408,000 £364,000 5 2.9%
Cromwell Road 173 £62,034,000 £359,000 11 6.4%
North Hyde Road 172 £61,905,000 £360,000 7 4.1%
West End Lane 162 £47,604,000 £294,000 13 8.0%
Cleave Avenue 161 £56,411,000 £350,000 8 5.0%

Yet, did you really think I wouldn’t get at all serious ..

The basic rudiments of the Hayes property market remain principally healthy in many parts of Hayes, yet the existing political environment means that the vital element of confidence has been diminished slightly in certain parts, and that is triggering a minority of potential property purchasers and house-sellers to vacillate, yet with unemployment at an all-time low, a record number of people with a job, ultra-low interest rates and decent mortgage availability (with the Banks and Building Societies tending to drop mortgage rates instead of increasing them), those Hayes first time buyers (and especially Hayes buy-to-let landlords) who have adjourned their next house purchase because of perceived political uncertainty should be reminded that talking to many of my fellow Hayes agents they have more homes on their books than at any time for the last three or four years, so there is a greater choice of Hayes properties to call your next home/BTL investment with a potential of securing a great property deal in the next month or so.

Irrespective of what happens with Brexit, Hayes people will still need a roof over their heads and as I have mentioned on a number of occasions, I have proved beyond doubt we aren’t building enough homes both locally in Hayes and nationally. If supply is limited and demand increases (as the population grows and we get older), prices in the medium to long term can only go in one direction. Upwards!

So, whatever happens with BoJo and Brexit – why wait, because once we get over that hurdle, there will just be another hurdle and another hurdle and by which time – we will be in 2029 and you would have missed the boat. We survived the Global Financial Crash, 3-day week in 1970s’, hyperinflation etc etc …  yet the choice is yours.

How Many Hayes Homeowners Have Paid Their Mortgage Off?

The Government’s Annual Housing Survey is 50 years old this year.  It has taken a snap shot of the UK’s property market every year since 1969 and in the recently published report for 2018, it wasn’t a surprise that owner occupation is still the most predominant tenure, yet now more people own their home without a mortgage rather than having a mortgage as the number people buying their first home (obviously with a mortgage) has declined since the Millennium.  The report also shows homeowners (mortgaged and owned outright) are, on average, older than renters and between the homeowners themselves, those who are mortgage free are older than those with a mortgage.

Looking at the most recent of data for Hillingdon, I wanted to see how we compared to the national picture. Therefore, focusing on the main 4 tenures of owned outright, owned with a mortgage, social housing (i.e. Council Housing and Housing Association) and private rented, this is what I found out…

Hillingdon – Tenure by Age
Age Owned Outright Owned with Mortgage Social Housing Private Rented
Age 24 & Under 3.8% 8.7% 21.1% 66.4%
Age 25 to 34 4.2% 35.7% 17.8% 42.3%
Age 35 to 49 8.7% 53.0% 16.6% 21.7%
Age 50 to 64 32.9% 42.5% 15.0% 9.6%
Age 65 to 74 65.3% 11.9% 17.5% 5.3%
Age 75 + 71.8% 6.0% 17.6% 4.7%

Looking at the stats, you can see that homeownership in Hayes and council area as a whole (both owned and owned with a mortgage combined) is lower in the 25yo to 34yo age range compared to 35yo to 49yo, yet roll the clock back to the 1980s and opposite was the case.

So how many local homeowners have paid off their mortgage?

43.4% of Hayes and Hillingdon homeowners are mortgage free, yet of the 19,722 households that are owned by 50yo to 64yo in Hayes and the Hillingdon area, 56.4% of those people still have a mortgage.

As most people bought their first house in their early to mid 20’s back in the 1980’s, this shows that a lot of Hayes and Hillingdon people must have re-mortgaged in the past and extended their borrowings (otherwise they should have paid their mortgage off now).

The other thing that concerns me is the 6% of the Hayes and Hillingdon over 75yo homeowners that have a mortgage.

If you amalgamate the national historic ranges going back to 1977 (see the graph below “UK Households with a Mortgage by Age – 1977 to 2018” and note the age bands are slightly different to the recent local stats because they were carried out under different government departments), you will see the number of people who own a property with a mortgage has been dropping since the Millennium, yet nationally the number of people who own a property has remained roughly the same, even with the growth of the private rented sector.

If you amalgamate the national historic ranges going back to 1977 (see the graph below “UK Households with a Mortgage by Age – 1977 to 2018” and note the age bands are slightly different to the recent local stats because they were carried out under different government departments), you will see the number of people who own a property with a mortgage has been dropping since the Millennium, yet nationally the number of people who own a property has remained roughly the same, even with the growth of the private rented sector.

Reports in the industry suggest that in the next ten years that will increase, as nearly 1 in 5 homeowners will be still paying off their mortgage after retirement. One of the reasons behind that will be the legacy of interest-only loans and delayed first-time buying as we become more and more like Germany in our house ownership models, where people naturally rent their homes until their 50’s and then buy when they inherit money from their parents.

In the meantime, demand for Hayes rental properties will only increase … so good news for Hayes Buy to Let landlords and indirectly Hayes homeowners as well.

Hayes Property Market Update Summer 2019

The foundations of the Hayes Property Market over the summer have continued to be principally sound; yet the existing political macroclimate means that the critical element of consumer confidence has been reduced and that is triggering some potential Hayes property buyers and Hayes house sellers to falter slightly and hang fire making any firm decisions on property.

With record low interest rates at 0.75%, low unemployment rates of 3.8%, and decent mortgage availability (even those with low deposits – there were 224 mortgage deals available on the day of writing this article where only a 5% deposit was required and 5 main stream lenders that would offer 100% no deposit mortgages), Hayes buyers have a lot going in their favour, aside from the perceived political uncertainty. 

Interestingly, Rightmove have stated there are more properties for sale today in the Country, than at any time since 2016, and Hayes follows that trend. Even with that in mind, property values have remained reasonably stable as The Land Registry has just released its House Price Index for Hayes and the surrounding locality and it makes very interesting reading.

Overall, property values in the Hayes area are 1.4% lower

than a year ago as the average property value in Hayes now stands at £367,700.

When I looked at the types of Hayes properties, a slightly different picture appeared ..

  • Hayes Detached homes dropped by 0.6%
  • Hayes Semi-detached homes dropped by 0.4%
  • Hayes Terraced/Town-House dropped by 0.9%
  • Hayes Flats/Apartments dropped by 2.6%

and splitting down the types of Hayes into property types ..

  • Hayes Detached £522,100
  • Hayes Semi-Detached £421,400
  • Hayes Terraced/Town-House £371,700
  • Hayes Flats/Apartments £254,000

Yet, Hayes Property Market Blog readers will know I always like to measure the health of the Hayes property market not only by house prices but transaction levels as well ..

451 properties were sold in the last year in Hayes,

 lower than the 10-year average of 721 properties per annum

Considering the uncertainty the Country has been through in the last three years with the ‘B’ word issue, I don’t think that’s too bad and shows the underlying resilience of the Hayes property market.

Now looking forward towards the end of the year .. how will Hayes house values change under the new Prime Minister?

Hayes buy-to-let landlords and Hayes first-time buyers seem to be sustaining their preceding activity levels, which is heartening news. It’s quite conceivable that both cohorts are presently profiting from the marginally increased numbers of Hayes homes on the market, which not only offers them greater choice, but aids with their negotiations. The suggested Stamp Duty changes made me look at previous Stamp Duty changes in the last decade and their effects have been rather short term.

That means those selling their homes in Hayes need to be realistic with their pricing, and, as most sellers also buy a property, what you might lose on your sale you will make up on the purchase. 

BoJo, Brexit … to be honest are all short-term distractions from the long-term issues of the UK and Hayes property market. Until we start building at least 300,000 properties a year to meet the demand for UK property, demand will always outstrip supply, meaning irrespective of short-term fluctuations that may (or may not) be caused by domestic and world events (including the ‘B’ word’), prices will always in the medium to long term remain stable and increase.